What Is Mean? Everything You Need to Know
Introduction
Have you ever wondered why every news channel seems to cite “average” values for practically everything—whether it’s the average mileage of cars, the average temperature for the month, or the average time people spend on social media? These “averages” are often forms of the mean, a mathematical concept that serves as one of our most fundamental tools for summarizing large sets of numbers. Given the ubiquity of the word “average,” it’s no surprise that many of us ask, “What is mean?” and how does it actually help us in daily life?
This comprehensive guide will delve into what the mean (often called the arithmetic mean or average) truly is, how it’s calculated, and why it’s so crucial in fields like business, science, education, and even sports. We’ll trace its historical roots, examine how to use it correctly (and when not to use it), and explore its applications from everyday tasks like splitting the dinner bill evenly to advanced research contexts like econometrics and data analytics.
By the end of this article, you’ll not only answer, “What is mean?” with clarity but also understand how mastering the concept of the mean can boost your decision-making, problem-solving, and critical thinking skills. Let’s dive right in!
A Straightforward Definition: What Is Mean?
Core Explanation
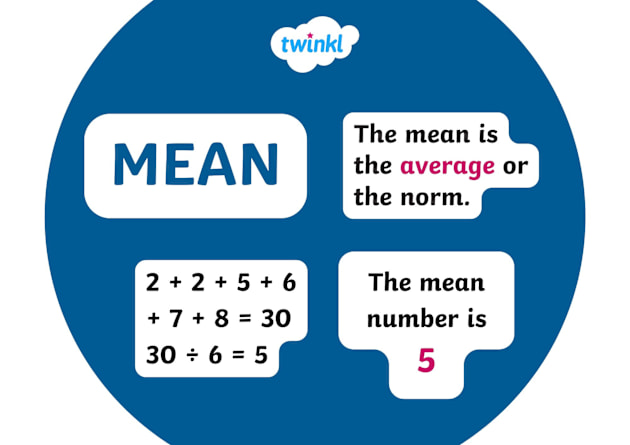
In mathematics and statistics, the word “mean” generally refers to the arithmetic mean, or simply the average. In the most elementary sense, it’s what you likely learned in school:
For instance, to find the mean of 4, 7, and 9:
- Sum the values:
- Count how many values: 3
- Divide the sum by the count:
The mean—approximately 6.67—represents the “central” or “typical” value of that set. This is the essence of what is mean? in arithmetic terms.
Key Characteristics
Sensitive to All Values: The arithmetic mean takes every single value into account, so an extremely large or small number (an outlier) can strongly shift the mean.
Single Number Summary: One major advantage is how the mean condenses a data set into a single figure—a quick snapshot of overall level or tendency.
Universally Recognized: Among all measures of central tendency, the mean is the most widely recognized. People commonly interpret “average” to mean the arithmetic mean, though other types of means do exist (geometric, harmonic, etc.).
Direct Relationship to Totals: Because the mean is the total of values divided by count, you can easily recover the total sum if you know the mean and the number of items.
While the arithmetic mean is not the only measure of central tendency (we also have the median, mode, and others), it often remains the first tool in our analytical toolbox for summarizing data.
Historical or Contextual Background
If you’re pondering “What is mean?” you might not immediately think about its historical roots. Yet, the concept of averaging has been used for millennia, from ancient Babylonian traders approximating grain harvests to modern data scientists analyzing massive datasets.
Ancient Civilizations
Babylonians: Historical records indicate that Babylonians used forms of arithmetic for commerce, astronomy, and taxation. While we lack explicit references to the “arithmetic mean” in texts from thousands of years ago, the idea of summing items and dividing by their quantity was almost certainly practiced in everyday problem-solving.
Greek and Alexandrian Scholars: Greek mathematicians such as Pythagoras (c. 570–495 BCE) and Archimedes (c. 287–212 BCE) contributed to numerical theories. Although the concept of mean was not singled out as a formal measure, they heavily employed ratios and proportions, which laid the groundwork for the idea of dividing totals by counts.
Middle Ages and Renaissance
Islamic Golden Age: Mathematicians like Al-Khwarizmi (c. 780–850) studied algebra, numerals, and arithmetic, translating Greek works and expanding them. Concepts akin to averaging likely appeared in their problem-solving approaches and in government finance records.
European Advancements: As trade networks spread in the late Middle Ages, merchants needed standardized ways to compute fair prices, taxes, or resource usage. “Average” calculations became part of commercial arithmetic, documented in so-called “reckoning manuals” or “summae de arithmetica.”
The Formalization of Statistics
17th to 19th Century: Astronomy, demography, and probability theory fueled a growing need to interpret data sets. Figures like John Graunt (1620–1674) analyzed population data for mortality rates, effectively using early forms of means.
Advent of Formal Statistics: The 19th century saw mathematicians like Carl Friedrich Gauss (1777–1855) and Adrien-Marie Legendre (1752–1833) develop the method of least squares, heavily reliant on the concept of mean to minimize errors. By the 20th century, “average” statistics had become mainstream in science, government, and business.
Modern Day Relevance
Today, “mean” is ubiquitous in everyday discourse. Weather forecasts highlight average temperatures, economists talk about average incomes, and educators consider class averages on tests. Our question, “What is mean?” resonates throughout data-driven societies, illustrating its well-rooted historical significance and ongoing importance.
In-Depth Exploration / Main Body
Now that we’ve got the basics, let’s explore the mean in more detail—examining its different facets, examples, and notable points of confusion or debate.
1. Mean vs. Other Measures of Central Tendency
When people say “average,” they frequently imply the arithmetic mean, but in statistics, there are multiple ways to define a “central” value:
- Mean: Sum of values / number of values
- Median: The middle value when the data is sorted
- Mode: The most frequently occurring value
Knowing which measure is appropriate can depend on the data set:
- Mean is generally a good “overall” indicator but can be skewed by outliers.
- Median is more robust against extreme values.
- Mode can be useful in categorical data or for understanding which item is most common.
2. Weighted Mean
Weighted mean (or weighted average) is a generalized form of the arithmetic mean. Not all observations carry the same importance or frequency. Instead of each data point having equal weight, certain values can have more influence than others. The formula typically looks like this:
where is a data point and is the weight for that data point. Weighted means come into play in various real-life scenarios—for instance, your final grade in a class might weigh exams more heavily than homework.
3. Geometric Mean and Harmonic Mean
Outside the arithmetic mean, mathematicians and statisticians often use other specialized means:
- Geometric Mean: Involves multiplying values (e.g., returns in finance) and taking the nth root. This helps in measuring growth rates or dealing with percentages over time.
- Harmonic Mean: Useful for ratios and rates, such as average speed. If you travel half a distance at one speed and half at another, the harmonic mean is more relevant than the arithmetic mean.
Though these forms differ from the standard definition of “mean,” they expand the original concept to suit more complex data.
4. Mean in Different Contexts
a) Education
Teachers often calculate the mean score of a test to gauge how an entire class performed, giving a single number that suggests the overall proficiency. However, one or two extremely high or low scores can distort the average.
b) Business and Economics
In business, “average revenue per user” (ARPU) is a common metric, particularly in industries like telecom or subscription services. The mean encapsulates the total revenue, spread across the user base. Meanwhile, in economic data, we often see average income or average GDP per capita. But remember: A handful of ultra-wealthy individuals can inflate the average, making the mean less representative.
c) Science and Research
From physics experiments to clinical trials, the mean helps researchers unify data from repeated observations. The concept of “standard error of the mean” arises here, denoting how reliable (or uncertain) a sample mean is as an estimate of a population mean.
d) Sports Analytics
Whether it’s a baseball player’s batting average or a basketball player’s points per game, the mean reappears in myriad sports contexts. On the flip side, outliers—like extremely good or bad performances—can distort the average, prompting analysts to also look at median or advanced metrics.
5. Common Calculation Pitfalls
- Forgetting Negative Values: In certain data sets, negative figures might exist (e.g., temperature below zero). When mixing positives and negatives, watch out for how sums might cancel out.
- Inclusion of Zero: Ensure you count zero in the sample size. Some novices forget that zero is a legitimate data point.
- Mixing Averages: If the data is grouped, an average of averages might be misleading. For instance, you can’t just average the means of multiple classes if they have different numbers of students. Weighted means come into play here.
- Rounding Errors: In finances, repeated rounding can accumulate. Rounding the mean at each step might yield slightly incorrect totals. The best practice is to keep extra decimal places until the final result.
6. Example Cases and Scenarios
- Splitting the Bill: You and three friends go to a restaurant, and the total is $100. The mean cost per person is $25. This is often how we handle group expenses—though be mindful if some had a small salad while others had steak. In real life, the mean might feel unfair if consumption is unequal.
- Average Speed: If you drive 60 miles per hour for 1 hour, then 40 miles per hour for another hour, your mean speed is
But if you cover half the distance at 60 mph and half at 40 mph, you need to handle a harmonic mean, not a straightforward arithmetic mean. This discrepancy is a classic example in physics.
- Exam Averages: Imagine exam scores of 70, 72, 95. Summation is
The number of tests is 3. The mean is 237/3=79. Just keep in mind that one outlier score (like 95) can shift the average from mid-70s to nearly 80.
Importance, Applications, or Benefits
1. Simplifies Complexity
When confronted with large amounts of data, we need a quick summary. The mean is an elegant solution: it compresses potentially hundreds or millions of numbers into a single representative figure.
2. Critical in Statistical Inference
Almost every statistical test—like t-tests, ANOVAs, regressions—revolves around means. Inferring population parameters typically includes analyzing sample means. If you’re interpreting research studies, you often come across average values for blood pressure, average satisfaction scores, or average reaction times.
3. Decision-Making Across Domains
- Business and Finance: Weighted means decide portfolio returns or budget allocations.
- Healthcare: Hospitals track average patient stay lengths to optimize resources and services.
- Urban Planning: City planners analyze average daily traffic to design roads or public transit routes.
4. Foundational for Other Metrics
Measures like variance or standard deviation rely on the mean. Variance is computed by looking at how far each data point deviates from the mean. So to interpret advanced statistical methods, understanding the mean is essential.
5. Enhanced Critical Thinking
Recognizing the difference between mean, median, and mode fosters deeper skepticism when reading sensational headlines—like “the average household net worth is $X,” ignoring that outliers skew the result. Mastery of the mean can help you question or confirm claims about data.
Address Common Misconceptions or FAQs
Misconception 1: The Mean Must Always Lie in the Middle
Reality: If your data is highly skewed or has big outliers, the mean can be pulled in a direction that might not appear visually “central.” The median might better represent “the middle,” whereas the mean is susceptible to large extremes.
Misconception 2: A High Average Implies Everyone Experiences That Level
Reality: The phrase “on average” doesn’t guarantee that the majority are near that figure. For instance, if three people earn $30k and one person earns $210k, the average is $75k, but only one person actually has income near or above that average. This misunderstanding is common in income or wealth distribution debates.
Misconception 3: The Arithmetic Mean Is Always the “Best” Summary
Reality: Each measure of central tendency has its place. The mean is not always ideal—especially with heavily skewed or categorical data sets. In some cases (like incomes or property values), the median can be more representative.
FAQ 1: What is mean? (In a nutshell)
Answer: It’s the arithmetic average. Sum your data points, then divide by how many points you have. That result is the mean, a quick snapshot of central tendency.
FAQ 2: How to handle outliers when computing the mean?
Answer: Consider removing or adjusting outliers only if they’re errors or unrepresentative anomalies. Otherwise, you might opt for a trimmed mean (ignoring the largest and smallest few data points) or switch to a median if the distribution is extremely skewed.
FAQ 3: Does the mean always require real or decimal numbers?
Answer: The concept of a mean typically applies to any numeric domain, from integers to real numbers. However, you might get fractions or decimals that are not integers. That’s normal—just interpret them accordingly.
FAQ 4: Why do some contexts speak of a geometric mean?
Answer: The geometric mean is particularly helpful when dealing with growth rates or multipliers. For example, if a stock grows by 30% one year and 10% another year, the geometric mean better captures the overall growth rate than the arithmetic mean.
FAQ 5: Is it possible for negative values to yield a positive mean?
Answer: Sure, if enough large positive values offset the negative ones, the total sum might be positive. It depends on the relative magnitudes and the count of data points.
Modern Relevance or Current Trends
As our world becomes more data-rich, the question “What is mean?” remains timely—even if it’s not posed directly. The concept underlies many contemporary discussions:
1. Big Data and AI
Machine learning often begins by calculating the mean of features for data preprocessing or baselines. Then, advanced algorithms might revolve around adjusting weight vectors to minimize average errors. Neural networks often compute average loss (or mean squared error) in training.
2. Data Journalism
Journalists analyzing data sets might quickly glance at an average to see if something is newsworthy, like “the average rent across the city has risen by 10%.” But more advanced journalists also explore distribution shapes (like how rent might vary drastically across neighborhoods).
3. Business Intelligence Dashboards
Companies operating digitally tend to track metrics such as average session duration, average items in a cart, or average daily active users. This helps decision-makers spot trends or anomalies quickly.
4. Cloud Computing and Cost Averages
Some organizations rely on average CPU usage or average bandwidth usage to optimize server resources or cloud instance configurations. Again, outliers might exist, but the mean is a quick gauge to set base capacity planning.
5. Changing Educational Approaches
Some educators suggest that focusing solely on class mean might not reflect an individual’s success or the distribution of performance. As a result, there’s a shift toward more robust analytics, but the mean still holds a valuable place as an initial snapshot.
In short, big data solutions, real-time analytics, and advanced modeling keep the concept of an average (mean) central to how we interpret large volumes of information, reinforcing its timeless relevance.
Conclusion
Key Takeaways
- Foundational Concept: The mean is one of the simplest but most powerful ways to summarize a data set, capturing a single “average” figure that reflects all points.
- Definition and Properties: At its simplest, “mean” is the sum of numbers divided by how many there are. This measure is sensitive to outliers and might not always represent “the middle” if the distribution is skewed.
- Applications: From dividing a dinner tab to advanced data analytics, the mean is ubiquitous across personal finance, scientific research, sports, economics, and more.
- Contextual Suitability: While the mean is widely used, it’s not always the best measure, especially when data is extremely skewed or purely categorical.
- Evolution and Modern Trends: In an era of big data, AI, and comprehensive analytics, the mean remains at the heart of summarizing large sets of numbers, albeit complemented by other measures.
Why Understanding the Mean Matters
The question “What is mean?” might appear elementary, but behind that seemingly straightforward operation lie deeper layers of insight into how we collect, interpret, and communicate information. Mastering the mean helps you:
- Make sense of everyday statistics—like average incomes, test scores, or product reviews.
- Engage critically with news headlines boasting “averages.”
- Develop a starting point for deeper statistical analysis, leading to more nuanced or robust measures like median, mode, or standard deviation.
- Improve your data literacy, a crucial skill in an information-saturated world.
Call to Action
- Dive Deeper: If you’re intrigued by the power and pitfalls of the mean, explore related topics like variance, standard deviation, median, mode, or even advanced forms of means (geometric, harmonic).
- Discuss: Share this post with students, colleagues, or friends. Encourage a conversation about how “average” shapes their understanding of headlines or personal finances.
- Practice: The next time you see an “average price” or “average rating,” ask yourself how the data might be skewed and whether the mean truly represents the distribution.
- Learn Online: Platforms like Khan Academy, Coursera, or edX offer courses on basic statistics, so you can strengthen your understanding of the mean and other statistical concepts.
Feel free to drop your thoughts or questions in the comments—especially if you have an interesting scenario where the mean was particularly useful or misleading. Let’s continue to raise our numerical awareness and make well-informed decisions in everyday life, one average at a time.
Additional Resources
Online Tutorials
- Khan Academy – Free lessons on arithmetic mean, weighted mean, and more advanced statistics.
- YouTube Channels (e.g., Numberphile, CrashCourse) – Entertaining yet insightful videos on math concepts, including mean, median, and mode.
Books and Guides
- The Cartoon Guide to Statistics by Larry Gonick and Woollcott Smith – Lighthearted introduction to stats, includes explanation of mean and related measures.
- Statistics by David Freedman, Robert Pisani, and Roger Purves – A thorough text offering real-world examples of means, medians, and distribution shapes.
Local and Online Courses
- Community Colleges – Offer basic to intermediate courses that start with the concept of mean before diving into deeper statistical methods.
- MOOCs – Check out platforms like Coursera or edX for “Introduction to Statistics” or “Data Science” courses that spend significant time on means, variance, correlation, and more.
Professional Tools
- Microsoft Excel or Google Sheets – Easy for quickly computing arithmetic means (the
AVERAGE()function). - R or Python – Great for those diving deeper into data analysis. Functions like
mean()in R orstatistics.mean()in Python handle data sets of varying size.
- Microsoft Excel or Google Sheets – Easy for quickly computing arithmetic means (the
Community Engagement
- Reddit’s r/statistics or r/learnmath – Ask questions and discuss your mean-related queries with fellow learners or experts.
- Stack Exchange (Cross Validated) – A Q&A platform for more advanced stats questions about the best measure of central tendency in specific research designs.
With a grasp of these resources, you’re well-equipped to expand your knowledge of the mean, from your first calculations to more intricate real-world data sets. Understanding “what is mean?” is merely the opening gateway to the vibrant, ever-evolving universe of numbers and statistics.