6.2 Energy Diagrams: Visualizing Energy Changes in Chemical Reactions
Energy diagrams, also called potential energy diagrams, are essential tools in understanding how energy changes during chemical reactions. These visual representations allow us to see the potential energy levels of reactants and products, the activation energy required, and whether a reaction is endothermic or exothermic.
What Are Energy Diagrams?
Energy diagrams illustrate the potential energy of the reactants and products as a reaction progresses. They show the activation energy (Ea) required for the reaction and indicate whether the reaction is endothermic (energy absorbed) or exothermic (energy released).
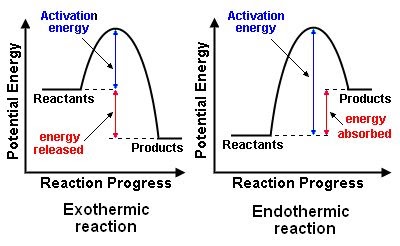
Image Courtesy of Pinterest
Key Components of Energy Diagrams:
- PEreactants: The potential energy of the reactants at the start of the reaction.
- PEproducts: The potential energy of the products after the reaction is complete.
- Activation Energy (Ea): The minimum energy needed for reactants to transform into products, represented by the highest point on the energy diagram.
- Activated Complex: The temporary, unstable arrangement of atoms at the peak of the energy barrier before forming products.
Exothermic vs. Endothermic Reactions
- Exothermic Reactions: The potential energy of the products is lower than that of the reactants. Energy is released during the reaction, making ΔH negative.
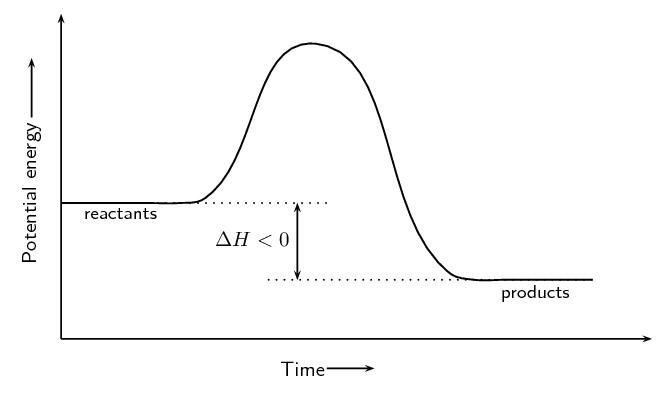
Image Courtesy of SilaVula
- Endothermic Reactions: The potential energy of the products is higher than that of the reactants. Energy is absorbed, making ΔH positive.
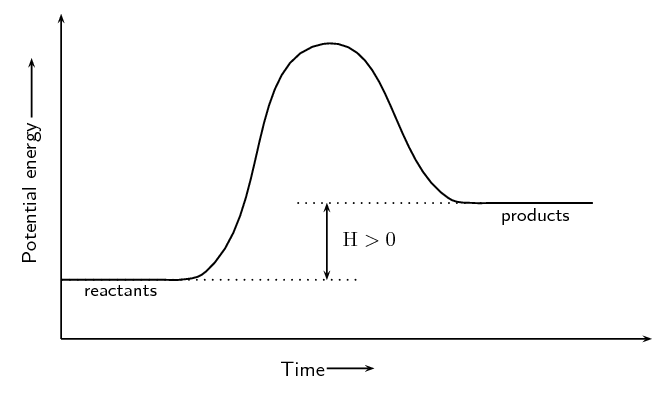
Image Courtesy of SilaVula
Reviewing Enthalpy (ΔH) and Energy Changes
Enthalpy (ΔH) represents the heat energy change during a reaction. When products have lower enthalpy than reactants, the reaction releases heat (exothermic). When products have higher enthalpy than reactants, the reaction absorbs heat (endothermic).
Quick Overview of Phase Changes:
- Melting (Solid → Liquid): Endothermic
- Vaporization/Boiling (Liquid → Gas): Endothermic
- Sublimation (Solid → Gas): Endothermic
- Condensation (Gas → Liquid): Exothermic
- Freezing (Liquid → Solid): Exothermic
- Deposition (Gas → Solid): Exothermic
Phase changes also involve latent heat, the heat absorbed or released without a change in temperature.
How to Read Energy Diagrams
Exothermic Reactions:
- Energy Diagram Characteristics:
- PEproducts < PEreactants
- Negative ΔH
- Energy is released into the surroundings.
- Example: Combustion reactions.
The activation energy is lower, making it easier for reactants to transform into products. The energy released often manifests as heat.
Endothermic Reactions:
- Energy Diagram Characteristics:
- PEproducts > PEreactants
- Positive ΔH
- Energy is absorbed from the surroundings.
- Example: Melting ice or photosynthesis.
The higher activation energy means more energy input is needed for the reaction to proceed.
Real-Life Example: Energy Diagrams and Phase Changes
Let’s use melting and condensation as examples:
- Melting (H₂O(s) → H₂O(l)): Endothermic; heat is absorbed.
- Condensation (H₂O(g) → H₂O(l)): Exothermic; heat is released.
Energy diagrams for these processes show whether the energy of the system increases (endothermic) or decreases (exothermic).
Example Practice Problem: Understanding Energy Diagrams
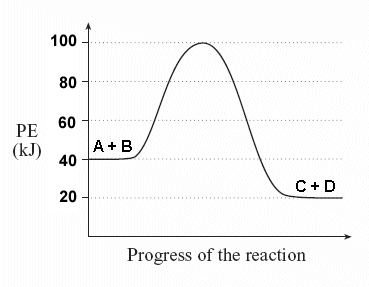
Image Courtesy of Socratic
Given the energy diagram:
What is the potential energy of the reactants?
Look at the y-axis for the reactants: 40 kJ.What is the potential energy of the products?
Look at the y-axis for the products: 20 kJ.What is the value of ΔH?
Calculate: ΔH = PEproducts – PEreactants
ΔH = 20 kJ – 40 kJ = -20 kJ
Energy is released, indicating an exothermic reaction.What is the activation energy?
Find the difference between the energy of the activated complex and PEreactants:
Ea = 100 kJ – 40 kJ = 60 kJIs this reaction endothermic or exothermic?
Since ΔH is negative and PEproducts < PEreactants, it’s exothermic.
Energy Diagrams and Reaction Analysis
Energy diagrams allow us to visualize:
- The activation energy barrier.
- Whether a reaction releases or absorbs heat.
- The enthalpy change (ΔH).
They are powerful tools for predicting reaction spontaneity, stability of products, and energy changes during physical and chemical processes.
Explore More:
- Understanding Enthalpy Changes
- Phase Changes and Energy Transfer
- Activation Energy and Reaction Kinetics
Master energy diagrams, and you’ll gain a deeper understanding of the energy dynamics behind chemical reactions and physical processes. Good luck with your AP Chemistry studies!

