The Periodic Table and Average Atomic Mass
Understanding the numbers on the periodic table is crucial to mastering chemistry. Let’s break it down, focusing on subatomic particles and how they shape the elements we see on the periodic table.
Review of the Periodic Table 
Each element on the periodic table provides essential information:
Element Symbol: Every element is represented by a unique symbol, typically one or two letters—for instance, “C” for carbon.
Atomic Number: This number, located above the element symbol, represents the number of protons in an atom. It also tells us the number of electrons in a neutral atom.
Atomic Mass: Below the element symbol, you’ll find the atomic mass, expressed in atomic mass units (amu). It represents the average mass of an atom of that element, accounting for the number of protons and neutrons.
If you’ve ever wondered why the atomic mass is often a messy decimal, like 12.01 for carbon, that’s because it’s an average atomic mass. It considers all naturally occurring isotopes of an element, weighted by how often each isotope appears.
Isotopes and Average Atomic Mass
Isotopes are variations of an element that have the same number of protons but different numbers of neutrons. This means they share the same atomic number but have different atomic masses. The atomic mass listed on the periodic table reflects the weighted average of all isotopes of an element, based on their natural abundances.
Carbon’s Isotopes
Carbon, for example, has three naturally occurring isotopes:
Carbon-12: The most abundant form, making up about 98.9% of all naturally occurring carbon. It has an atomic mass of 12 amu.
Carbon-13: Makes up about 1.1% of carbon and has an atomic mass of 13 amu.
Carbon-14: Rare and present in trace amounts, it is radioactive and has an atomic mass of 14 amu. Carbon-14 is famous for its use in carbon dating, which helps determine the age of ancient organic materials.
The average atomic mass for carbon is calculated like this:
Average Atomic Mass (AAM) = (0.989 × 12) + (0.011 × 13) = 12.01 amu
This explains why the atomic mass of carbon on the periodic table is 12.01 rather than a nice, whole number. The small contribution from Carbon-13 influences the average.
Mass Spectrometry 
Mass spectrometry is a technique used to measure the mass and relative abundance of ions in a sample. It produces a graph called a mass spectrum, which helps identify isotopes and their relative abundances.
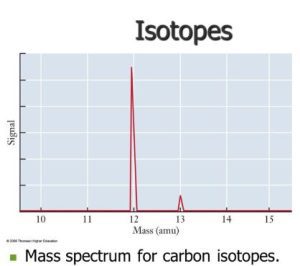
Imagine looking at the mass spectrum for carbon. You’d see two main peaks: one representing Carbon-12 and another for Carbon-13. The taller peak for Carbon-12 indicates it’s much more abundant in nature.
Calculating Average Atomic Mass from a Spectrum
Suppose we have a mass spectrum of an unknown element with three peaks:
Isotope 1 (24 amu): 82.8% abundance
Isotope 2 (25 amu): 8.1% abundance
Isotope 3 (26 amu): 9.1% abundance
To calculate the average atomic mass:
AAM = (0.828 × 24) + (0.081 × 25) + (0.091 × 26) = 24.263 amu
The element with an atomic mass close to 24.3 amu is magnesium (Mg), according to the periodic table.
Sample AP Chemistry Question
Consider a question from a past AP Chemistry exam. Let’s break down how to solve it step by step.
Question 2a Part i: Solving for Percent Abundance
Given: Average atomic mass (AAM) = 20.18, masses of isotopes = 19.99 and 21.99.
Equation: Set it up as follows:
20.18 = (x × 19.99) + ((1 – x) × 21.99)
Solve for x: x = 0.905
Conclusion: Ne-20 has 90.5% abundance, and Ne-22 has 9.5% abundance.
Question 2a Part ii: Converting Grams to Atoms
Use dimensional analysis to convert from grams to atoms. Start with the mass of neon, convert to moles using the molar mass, and then use Avogadro’s number to find the number of atoms.
Mass Spectrometry in the Lab
Mass spectrometry isn’t just a theoretical concept—it’s a powerful lab technique for analyzing substances. If you want a more in-depth explanation, check out Khan Academy’s excellent resources on mass spectrometry!
Key Takeaways
The atomic number represents the number of protons, while the atomic mass is an average of all naturally occurring isotopes.
Isotopes are atoms of the same element with different numbers of neutrons.
Mass spectrometry helps determine isotope abundance and calculate average atomic mass.
Calculating average atomic mass involves weighting isotopes by their relative abundances.
Mass Spectrometry: Understanding Isotopes and Average Atomic Mass
Mass spectrometry is an essential analytical technique used in chemistry to determine the mass and relative abundance of ions in a sample. It helps identify different isotopes of an element and measure how common each isotope is in nature. The result of this process is a graph known as a mass spectrum, which provides valuable insights into the makeup of elements.
The Mass Spectrum of Carbon
When analyzing carbon using mass spectrometry, we observe a mass spectrum that displays peaks for the different isotopes of carbon—mainly carbon-12 and carbon-13. Since carbon-12 is significantly more abundant, it generates a much larger signal compared to carbon-13, indicating its predominance in nature.

The mass spectrum of carbon provides a visual representation of the proportion of each isotope:
Carbon-12: Makes up about 98.9% of naturally occurring carbon, represented by a taller peak.
Carbon-13: Accounts for roughly 1.1% of carbon, leading to a smaller peak in the spectrum.
This information helps chemists understand how much each isotope contributes to the overall average atomic mass of carbon.
Applying Mass Spectrometry to Identify Elements
Mass spectrometry can also be used to identify unknown elements based on their mass spectra. For instance, let’s analyze an example of element X based on its mass spectrum.
Example Problem: Identifying Element X
Imagine we have a mass spectrum of an unknown element X with three peaks:
Isotope 1 (24 amu): 82.8% abundance
Isotope 2 (25 amu): 8.1% abundance
Isotope 3 (26 amu): 9.1% abundance
To calculate the average atomic mass (AAM) of element X:
AAM = (0.828 × 24) + (0.081 × 25) + (0.091 × 26) = 24.263 amu
From the periodic table, we can determine that this element is magnesium (Mg), which has an average atomic mass close to 24.3 amu.
Sample AP Chemistry Question: 2007 Exam
To illustrate the use of average atomic mass calculations in practice, let’s look at an AP Chemistry exam question from 2007. This question involves finding the percent abundance of isotopes.
Question 2a Part i: Calculating Percent Abundance
You are given an average atomic mass (AAM) of 20.18 amu and two isotope masses: 19.99 amu and 21.99 amu.
To find the percent abundance, we set up an equation:
20.18 = (x × 19.99) + ((1 – x) × 21.99)
Here, x represents the abundance of the isotope with mass 19.99 amu. Solving for x, we get x = 0.905.
Thus, the percent abundance is:
Ne-20: 90.5%
Ne-22: 9.5% (since the abundances must add up to 100%)
Question 2a Part ii: Converting Grams to Atoms
In this part, you need to convert a given mass of neon into atoms. This is where dimensional analysis comes into play.
First, use the molar mass of neon from the periodic table to convert grams to moles. Then, multiply by Avogadro’s number to find the number of atoms. In the second step, apply the percent abundance ratio to determine how many atoms are of Ne-22. The final answer for this conversion is approximately 3.558 × 10^22 atoms of Ne-22.
Mass Spectrometry in the Laboratory
Mass spectrometry isn’t just a theoretical concept; it is a powerful tool used in laboratories around the world. Chemists use it to determine the composition of unknown substances, identify isotopes, and even trace environmental contaminants. If you want to dive deeper into mass spectrometry, Khan Academy offers an excellent video lesson that covers the fundamentals of this powerful analytical technique.
Mass spectrometry remains a cornerstone of modern chemistry, helping us understand the composition of elements and molecules at a deeper level. So, the next time you see a mass spectrum, think of it as a window into the subatomic world, revealing the unique isotope “fingerprints” of an element.


