Vector and Scalar Fields
Scalar vs. Vector
Understanding scalar and vector quantities is foundational to analyzing vector and scalar fields. Here’s a quick breakdown:
Scalar Quantities
Described by magnitude (a numerical value) alone.
Examples:
Distance
Speed
Mass
Temperature
Example Sentence: She is five feet tall.
Arithmetic operations like addition and subtraction are straightforward.
Vector Quantities
Described by magnitude and direction (e.g., East, Up, Right).
Examples:
Displacement
Velocity
Force
Acceleration
Example Sentence: The gas station is five miles west of the car.
Represented graphically by arrows:
Length: Magnitude of the vector
Direction: Direction of the vector
Vectors can:
Be added/subtracted using vector operations.
Be multiplied by scalars to change their magnitude without altering direction.
Vector Fields
Properties
Magnitude and Direction: Every point in space is assigned a vector.
Representation: Arrows or curves.
Common Examples: Electric field, magnetic field, fluid flow.
Key Features
Magnitude:
Represented by the density of arrows or curves in a diagram.
Direction:
Represented by the orientation of the arrows.
Graphical Representation:
Each point in space is assigned an arrow indicating the vector’s magnitude and direction.
Applications:
Visualizing how quantities like force or velocity change across a region.
Example: A vector field could represent the wind velocity over a geographic area.
Real-Life Applications
Force Fields: Magnetic fields around a magnet.
Fluid Dynamics: Understanding flow patterns in liquids or gases.
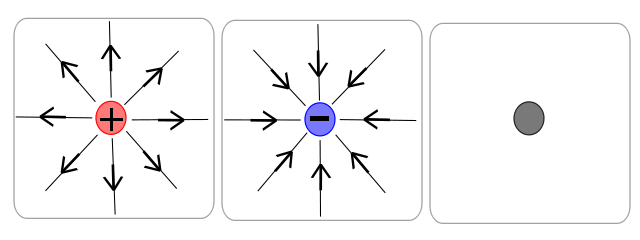
Physics: Visualizing electric fields created by charges.
- Two Point Charges
Scalar Fields
Properties
Magnitude Only: Each point in space is assigned a scalar value.
Representation: Contour maps or curves.
Common Examples: Temperature, pressure, electric potential.
Key Features
Magnitude:
Written directly on curves or indicated by a key.
Direction:
Scalar fields do not have direction.
Graphical Representation:
Contour maps show lines or regions of equal value.
Applications:
Analyzing how scalar quantities like temperature or pressure vary across an area.
Example: A temperature field showing how heat disperses in a room.
Real-Life Applications
Meteorology: Contour maps showing temperature or pressure variations.
Engineering: Density or pressure analysis in materials.
Physics: Representing electric potential in space.
Combining Vector and Scalar Fields
Vector and scalar fields can be used together to model complex systems. For instance:
Example:
A temperature scalar field combined with a velocity vector field can model fluid flow with temperature variations.
Example Visualizations
Vector Fields:
Arrows depict force fields or flow direction and intensity.
Scalar Fields:
Contour maps display regions of equal magnitude.
Conclusion
Vector and scalar fields provide powerful tools to model and analyze physical systems. Whether you’re exploring electric fields or understanding how temperature changes across a space, mastering these concepts unlocks deeper insights into the natural world.


