Unit 7.9: Phylogeny – Understanding Evolutionary Relationships
Phylogenetic Trees
Phylogenetic trees are powerful visual tools that help us understand the evolutionary relationships between different species. They can also offer a timeline of evolution by illustrating the extent of change in organisms over time. These diagrams depict evolutionary relationships through the distance between species: closely related species are positioned near each other, while less related species are placed farther apart.
Beyond showing these relationships, phylogenetic trees also highlight traits that were gained or lost over time. These diagrams are fundamental in evolutionary biology to help us explore connections between lineages, examine shared evolutionary paths, and study the development of different traits and characteristics. 🤓🌳
Cladograms vs. Phylogenetic Trees
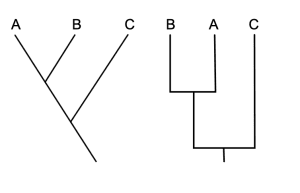
Phylogenetic trees and cladograms are similar in that they both display relationships between lineages. However, while cladograms focus on the similarities between traits, phylogenetic trees incorporate an additional dimension—the amount of evolutionary change over time. This timeline aspect is often calibrated using fossil records or a molecular clock.

Cladograms typically highlight shared morphological traits (observable characteristics like beak type or limb structure), making it easier to hypothesize relationships among species based on visible similarities. Phylogenetic trees, on the other hand, rely more on molecular data, such as DNA or protein sequences, to determine relationships. This type of data provides more precise evidence of evolutionary connections. 🦔

Speciation and Nodes
Both phylogenetic trees and cladograms illustrate the concept of common ancestry and speciation. Speciation is the process through which new species are formed. It occurs when a segment of a population becomes isolated—through geographical, reproductive, or ecological barriers—and evolves independently over time, eventually giving rise to a new species.
In these evolutionary diagrams, nodes represent points of divergence, where species split off from a common ancestor. Each node marks the most recent common ancestor of the diverging species and often indicates a shared, gained, or lost trait. The “out-group” is used to represent the species or lineage that is least closely related to the others depicted in the tree. 🦎
It’s important to remember that both phylogenetic trees and cladograms are based on hypotheses. As new scientific data emerges, these diagrams are revised to improve our understanding of evolutionary relationships. Although they help us make informed predictions about evolutionary history, they don’t always perfectly capture every detail of how species evolved.
Recent Posts
- 1.4 Understanding and interpreting a narrator’s perspective
- 1.3 Understanding how a story’s structure affects interpretations
- 1.2 Identifying and interpreting setting
- 1.1 Interpreting the role of character in fiction
- Unit 1 Overview: Introduction to Short Fiction
- Laws of Indices – Number & Algebra – IB Mathematics AA HL
- Standard Form – Number & Algebra – IB Mathematics AA HL
- 9.2 Crafting an argument through stylistic choices like word choice and description
- 9.1 Strategically conceding, rebutting, or refuting information
- Unit 9 Overview: Developing a Complex Argument
- 8.4 Considering how style affects an argument
- 8.3 Considering how all choices made in an argument affect the audience
- 8.2 Considering how sentence development and word choice affect how the writer is perceived by an audience
- 8.1 Choosing comparisons based on an audience
- Unit 8 Overview: Stylistic Choices
Choose Topic
- ACT (17)
- AP (20)
- AP Art and Design (5)
- AP Physics 1 (1)
- AQA (5)
- Artificial intelligence (AI) (2)
- Banking and Finance (6)
- Biology (13)
- Business Ideas (68)
- Calculator (72)
- ChatGPT (1)
- Chemistry (3)
- Colleges Rankings (48)
- Computer Science (4)
- Conversion Tools (136)
- Cosmetic Procedures (50)
- Cryptocurrency (49)
- Digital SAT (3)
- Edexcel (4)
- English (1)
- Environmental Science (2)
- Exam Updates (1)
- Finance (17)
- Fitness & Wellness (164)
- Free Learning Resources (209)
- GCSE (1)
- General Guides (40)
- Health (107)
- History and Social Sciences (152)
- IB (1)
- IGCSE (2)
- Image Converters (3)
- IMF (10)
- Math (39)
- Mental Health (58)
- News (8)
- OCR (3)
- Past Papers (463)
- Physics (5)
- SAT (39)
- Schools (3)
- Sciences (1)
- Short Notes (5)
- Study Guides (28)
- Syllabus (19)
- Tools (1)
- Tutoring (1)

