7.8 Representations of Equilibrium: Mastering Particulate Models
Why Represent Equilibrium Visually?
In previous sections, we tackled equilibrium mathematically using constants, concentrations, and ratios. But understanding equilibrium conceptually is just as critical! By using particulate models, we can visually represent and comprehend what is occurring at a molecular level when a reaction reaches equilibrium. This approach builds a holistic understanding of equilibrium beyond formulas and calculations.
What are Particulate Models?
Particulate models represent matter as discrete particles (atoms, molecules, ions), showcasing how reactions behave dynamically at equilibrium. These models are especially helpful for comparing how much reactant and product exists once equilibrium is established.
Understanding Equilibrium Through Particulate Diagrams
When equilibrium is achieved, reactions have a balance between the rate of forward and reverse processes. This doesn’t mean the reaction stops; rather, it reaches a state where no net change occurs. Visualizing this using particulate diagrams can help clarify what this balance looks like at the atomic or molecular level.
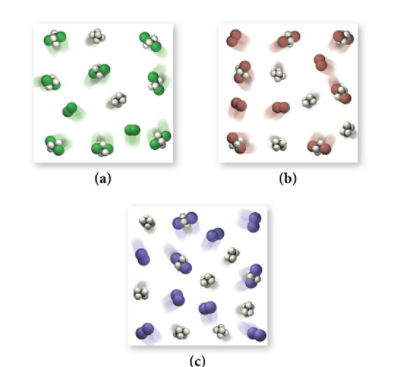
Image From BoylanChemistry
Example: C₂H₄ + X₂ ⇌ C₂H₄X₂
In this reaction, X₂ represents halogens like Cl₂ (green), Br₂ (brown), and I₂ (purple). Consider diagrams representing equilibrium concentrations for each halogen reaction at the same temperature:
- Compare the amount of product (C₂H₄X₂) in each diagram.
- Rank the equilibrium constants (K) for each scenario.
Key Insight: The more product particles present at equilibrium, the higher the equilibrium constant (K). This is because K measures the extent to which a reaction proceeds to form products.
Practice Problem: Analyzing Shifts in Equilibrium
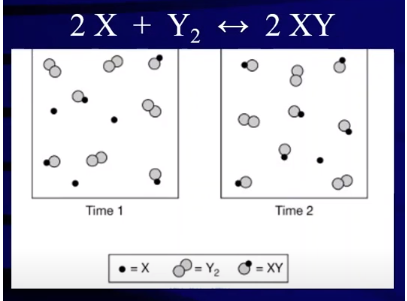
Image Courtesy of Abigail Giordano
Consider This Particulate Diagram Scenario:
You observe a reaction system represented by particles:
- Time 1: 4 molecules of XY (product).
- Time 2: 5 molecules of XY (product).
What happened? The increase in XY molecules shows that the reaction shifted right, producing more product. This also means reactant concentrations decreased during the same period, consistent with the stoichiometric relationships in the reaction.
Reverse Shift: If the reaction shifted left, XY would decompose back into reactants. For example, if 2 XY molecules break down, you’d form 2 X molecules and 1 Y₂ molecule. This visualizes how the reverse reaction occurs and shows how reactants can increase when equilibrium shifts.
Visual Representations and the AP Chemistry Exam
Particulate representations are not just conceptual tools—they can be tested on the AP Chemistry exam. You may encounter:
- Multiple-choice questions (MCQs) testing your understanding of equilibrium shifts.
- Free-response questions (FRQs) asking you to draw or interpret particulate diagrams.
Mastering these diagrams helps with:
- Explaining why equilibrium concentrations change.
- Predicting shifts based on changes in conditions (e.g., concentration, temperature).
- Linking visual representations to mathematical constants like K.
Key Takeaways for Particulate Models in Equilibrium
- Equilibrium constants (K): Larger values indicate reactions that proceed further to form products.
- Visual analysis: Particulate models show molecular distributions, making it easier to grasp shifts in equilibrium.
- Conceptual clarity: These models help solidify complex ideas and make mathematical calculations more intuitive.
- Practical application: Expect to use these skills on AP Chemistry exams, bridging the gap between visual and quantitative problem-solving.

